




EAFLOW · SOLUTIONS · CROSS-INDUSTRY SOLUTION · AREA 01

Live IT Inventory.
Technology portfolio that is visible
and governed.

Organize applications, owners, criticality, supported processes, vendors and integrations into a living base for decisions. Built on Operational Graph. Rapid visibility of the technology portfolio without launching a heavy enterprise architecture implementation. Cross-industry solution in Area 01 — EA/BPA modernization. Assisted implementation.

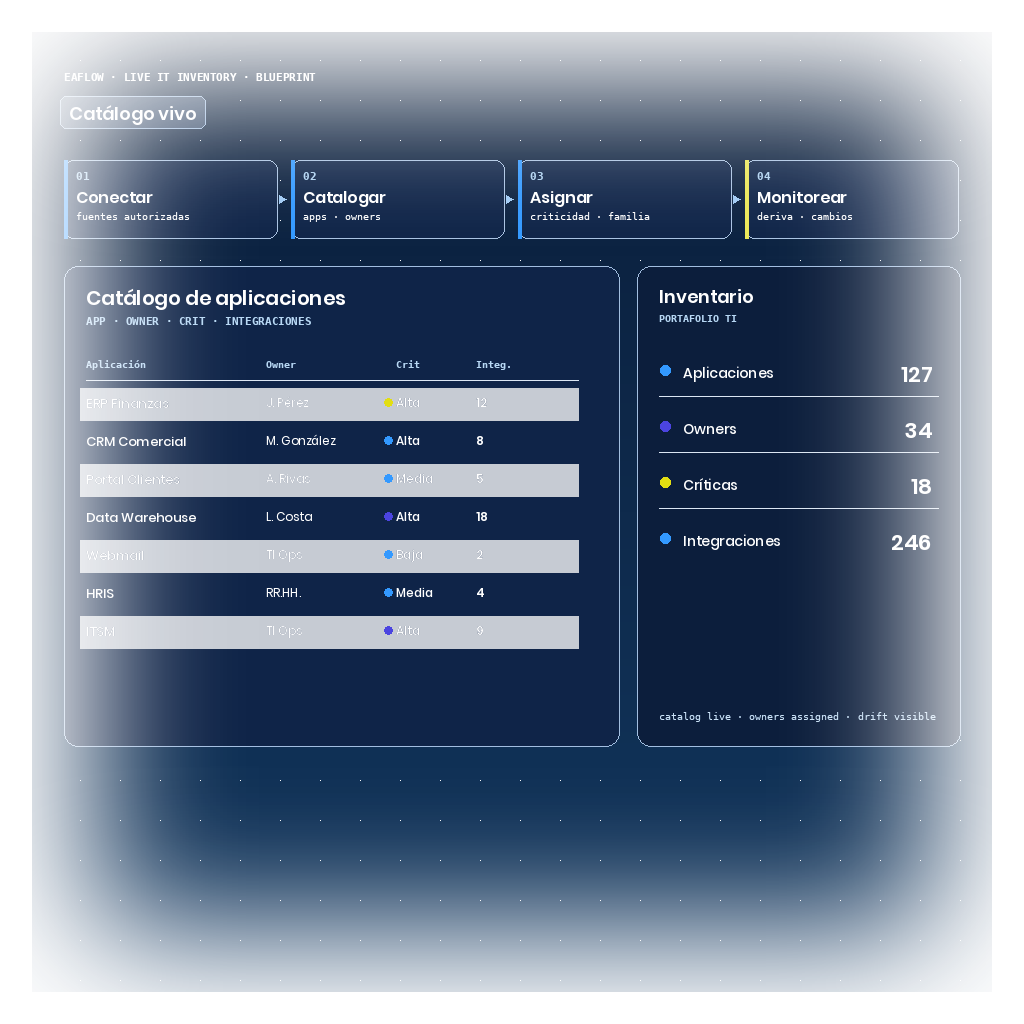
EAFlow blueprint with a living IT catalog: a table of applications with owner, criticality and integrations, and a side panel with portfolio counts (applications, owners, critical, integrations).
Category
Live technology portfolio inventory
Users
Architecture, IT portfolio management, application operations
Output
Live application catalog, owners, criticality, supported processes and integrations
Implementation
Packaged app with assisted implementation
Does not replace
Your current CMDB or application catalog; connects and enriches them on the graph

01 · What it is

Most IT portfolios live in spreadsheets that nobody keeps current.
Live IT Inventory is not that.

In most organizations, "application inventory" means an Excel spreadsheet someone assembled two years ago that nobody updates systematically. When a portfolio decision arrives — substitution, continuity, audit, change — the team reconstructs the view from scratch: who is the owner, which processes does it support, which systems integrate with it, what is the real criticality.

Live IT Inventory connects applications, owners, criticality, supported processes, vendors and integrations into one Operational Graph. The metadata for each application is registered once and queried every time a decision needs it. The inventory is not a report — it is a living base for decisions.

Visible, governed technology portfolio.

02 · Graph context

The graph entities that Live IT Inventory connects.

Live IT Inventory does not invent a parallel data model. It operates on the same Operational Graph that already holds your processes, applications, data, documents and owners. These are the entities the inventory connects:

  • Applications · The applications in the technology portfolio with their operational metadata
  • Owners · The responsible parties and owners of each application in the graph
  • Criticality · The functional and operational level that determines priority and risk
  • Processes · The business processes each application supports
  • Vendors · The vendors associated with each application in the portfolio
  • Integrations · The integration points between applications and external systems
  • Data · The data entities and dependencies connected to the portfolio
  • Decisions · The portfolio decision records associated with each node

When an application is declared in the graph, Live IT Inventory connects these entities and surfaces the full application profile as a queryable view. The relationships are already in the graph; visibility is a query, not a reconstruction.

03 · What you get

Concrete deliverables of a Live IT Inventory engagement.

A Live IT Inventory engagement produces five operational capabilities on top of your Operational Graph. Each one is built through governed registration, not universal automatic discovery, and each one is owned by your team at the close of the engagement.

Applies across: financial services, insurance, manufacturing, oil & gas, retail — wherever IT portfolio visibility is a prerequisite for evidence-based decisions.

  • Structured application catalog

    Every application in the portfolio is recorded with its operational metadata: name, owner, criticality, supported processes, associated vendors, key integrations and status. Not a spreadsheet — a queryable graph.

  • Owner and accountability map

    The inventory associates each application with its current owners. When a change, audit or portfolio decision touches an application, the graph surfaces who is accountable — without reconstructing the accountability chain.

  • Functional and operational criticality classification

    Each application receives a criticality profile traced to the processes it supports. Prioritization, continuity and substitution decisions rest on documented criticality, not on perception.

  • Integration and dependency map

    The graph records the integration points between applications and external systems. Before a change, migration or substitution, the team sees what depends on what — without rebuilding the map from scratch.

  • Executive portfolio dashboards

    Dashboards surface the portfolio by criticality, by owner, by vendor, by supported process and by integration status. The executive view is a query against the graph, not a manually assembled report.

04 · Capability catalog

Eight dimensions of visibility per application.

Each application in the portfolio is registered across eight visibility dimensions. Together they form the operational profile that supports architecture, continuity and governance decisions without rebuilding the information from scratch.

01 Application catalog
02 Owners and accountability
03 Functional and operational criticality
04 Supported processes
05 Associated vendors
06 Key integrations
07 Data and dependencies
08 Executive dashboards

Signs you need this

Consider EAFlow Live IT Inventory if:

  • Nobody has a clear picture of how many applications exist.
  • There are redundancies and applications without a clear owner.
  • Changes are evaluated using manual or incomplete information.
  • The IT team cannot explain risks and costs with evidence.

05 · Delivery

Assisted implementation. Scoped engagement. Ownership transferred.

Live IT Inventory is delivered as a scoped engagement, not as a download. EAFlow works alongside your team to bring the portfolio into the Operational Graph, establish governed update flows and transfer ownership at the close. The result is operated by your people, not by us.

Discovery

Scope on your IT portfolio

We identify the portfolio segment that matters most to model first — typically the critical applications of a domain, a value chain or a governance boundary. Scope is declared on the Operational Graph, not on a spreadsheet.

Population

Load the inventory with your team

We work alongside your team to register the applications, owners, criticality, supported processes, vendors and integrations in the scoped boundary. Population is governed — it does not rely on universal automatic discovery.

Adoption

Ownership transferred to your team

We transfer inventory operations to your team: how to extend the portfolio, how to keep metadata current through governed synchronization, and how to use dashboards for architecture and continuity decisions.

Delivered in scoped engagements. Owned by your team after handoff.

Industry context

Industry landings where this solution applies

Reference landings explaining how the Operational Graph applies in each sector. Insurance and Oil & Gas preserve EAFlow's scope boundary: IT, process, change and evidence context only.

Live IT inventory Application catalog Portfolio management EA/BPA modernization IT visibility Criticality traceability

Bring your IT portfolio to the table. We will walk through what Live IT Inventory would surface on your Operational Graph, and what an assisted implementation could look like for your governance.

Live IT Inventory is delivered as an assisted implementation on the EAFlow Operational Graph. Not a complete CMDB and does not promise universal automatic discovery — updates via governed synchronization.