


EAFLOW · SOLUTIONS · CROSS-INDUSTRY SOLUTION · AREA 02

Operational Continuity & Resilience.
Continuity plans on the graph,
not on assumptions.

Connect critical processes, applications, risks, controls, BIA, RTO/RPO, BCP, DRP, drills and evidence on the Operational Graph. Built on Operational Graph. Prioritize continuity plans, identify critical dependencies, record test results, monitor gaps and generate executive resilience dashboards. Cross-industry solution in Area 02 — risk, control and continuity. Assisted implementation.

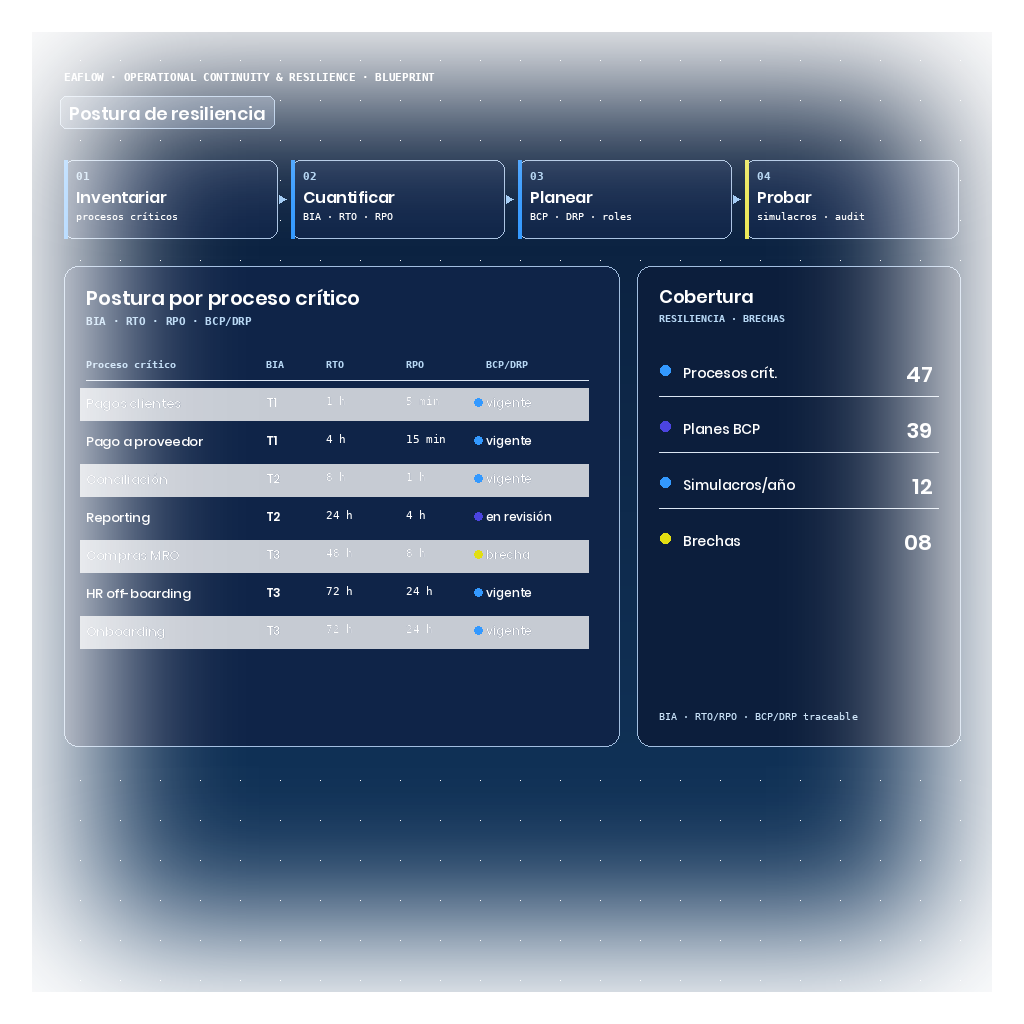
EAFlow blueprint with a resilience posture: a table of critical processes with BIA tier, RTO, RPO and BCP/DRP status (one gap highlighted in amber), and a side panel with coverage (critical processes, BCP plans, drills, gaps).
Category
Operational continuity and organizational resilience
Users
Business continuity, operational resilience, operational risk
Output
BIA, RTO/RPO, BCP/DRP, drill results, resilience dashboard
Implementation
Packaged app with assisted implementation
Does not replace
Your current continuity platform; adds connected evidence on the operational graph

01 · What it is

Most continuity plans live in documents disconnected from the operating map.
Operational Continuity & Resilience does not.

In most organizations, the BIA is a spreadsheet someone updated two years ago. BCPs and DRPs are PDFs that nobody knows are still current. Drills produce records that get filed without being linked to the processes they tested. When a real interruption occurs, the recovery team works from memory, not from a model.

Operational Continuity & Resilience connects critical processes, applications, dependencies, risks, controls, plans and evidence in the Operational Graph. The BIA is built by traversal of the graph. Plans are linked to the assets they cover. Drills record evidence against the process they test. The resilience dashboard shows the real state, not the assumed state.

Continuity plans on the graph, not on assumptions.

02 · Graph context

The graph entities that Operational Continuity & Resilience traverses.

Operational Continuity & Resilience does not create a parallel continuity model. It operates on the same Operational Graph that already holds your processes, applications, risks, controls and owners. These are the entities the resilience model traverses:

  • Processes · The critical processes whose interruption activates the continuity plan
  • Applications · The systems that support each critical process
  • Risks · The interruption risks tied to processes and applications
  • Controls · The preventive and recovery controls wired to the graph
  • Owners · The process, IT and continuity accountable parties at each node
  • Evidence · The records, evidence and test results from each drill
  • Dependencies · The process-to-application dependencies that determine recovery order
  • Plans · The BCPs and DRPs linked to the processes and assets they cover

When a critical process is declared in the graph, the solution traverses dependencies, applications, risks and associated plans to surface the complete resilience profile. The relationships are already in the graph; the continuity analysis is a query, not an interview.

03 · What you get

Concrete deliverables of an Operational Continuity & Resilience engagement.

An Operational Continuity & Resilience engagement produces five operational capabilities on your Operational Graph. Each one is built by traversal of the graph and is owned by your team at the end of the engagement.

Applies across: financial services, insurance, manufacturing, oil & gas, government and any sector where operational continuity is a regulatory or business requirement.

  • BIA grounded in the operating graph

    The Business Impact Analysis starts from the Operational Graph, not from a spreadsheet. Each critical process surfaces its applications, owners, dependencies and associated risks. Criticality is established on traced data, not on estimates.

  • RTO/RPO linked to the operating map

    Recovery time and recovery point objectives are recorded against the processes and applications in the graph. Any change in operating architecture updates the continuity context without manual reconstruction.

  • BCPs and DRPs connected to their processes and assets

    Continuity and recovery plans are not standalone documents: they are linked to the processes, applications, owners and controls they cover. The graph shows which plan applies to each node and what its current status is.

  • Drill and test records with evidence

    Each drill is recorded against the plan, the process and the owners in the graph. Test results, identified gaps and documentary evidence are linked to the corresponding node — not to a disconnected file folder.

  • Executive resilience dashboard

    The resilience dashboard consolidates plan status, test results, open gaps, tracking alerts and critical dependencies into a single governed view. Executives see the real state, not the reported state.

03b · Capabilities included

What the resilience model covers.

  • BIA — Business Impact Analysis on the graph
  • RTO/RPO — objectives linked to processes and applications
  • BCP and DRP — plans connected to the assets they cover
  • Drills — record against the plan and process being tested
  • Test results — traced against the graph node
  • Evidence — documentation linked to the drill and the plan
  • Process-to-application dependencies — for recovery order
  • Non-compliance risks — linked to critical processes
  • Resilience dashboard — consolidated executive status
  • Alerts and tracking — gaps and improvement actions

Signs you need this

Consider EAFlow Operational Continuity & Resilience if:

  • Plans exist but are not connected to critical applications or processes.
  • Continuity tests remain as isolated evidence.
  • The business cannot clearly see RTO/RPO gaps.
  • There is no traceability between incidents, exercises, plans and actions.

04 · Who runs it

Three roles. One operating resilience model.

Operational Continuity & Resilience engages three roles around every plan: the continuity manager who keeps plans current, the risk and governance owner who ensures coverage, and the IT operations team that executes recovery. All three operate on the same Operational Graph.

Continuity Manager

Keeps plans current and coordinates drills.

What they see

The critical process map with its applications, dependencies, RTO/RPO, associated plans and test status — all in the graph, without depending on emails or scattered spreadsheets.

What they do

Updates BCPs and DRPs on the graph, records drill results with linked evidence, identifies gaps and triggers tracking alerts to the relevant owners.

Risk and IT Governance Owner

Ensures that interruption risks are controlled and evidenced.

What they see

The interruption risks linked to processes and applications, with the status of associated controls, self-assessment gaps and evidence traceability by subject matter.

What they do

Reviews the status of preventive and recovery controls, validates that plans cover the registered risks, and produces resilience reports for committees and regulators.

IT Operations Team

Executes recovery when a real interruption occurs.

What they see

The process-to-application dependencies relevant to the recovery order, the DRP linked to the affected assets, and the contact for each owner — available from the graph, not from a folder nobody knows where to find.

What they do

Executes the DRP following the established recovery order, records completed steps as evidence in the graph, and notifies process owners when services are restored.

05 · Delivery

Assisted implementation. Scoped engagement. Ownership transferred.

Operational Continuity & Resilience is delivered as a scoped engagement, not as a platform license. EAFlow works alongside your team to bring the BIA, plans and critical dependencies into the Operational Graph and transfer ownership at the end. The resilience model is operated by your people, not by us.

Discovery

BIA on the existing graph

We identify the critical processes and their application dependencies on the Operational Graph. The BIA is built by traversal of the graph, not through interviews and spreadsheets. Scope is declared on what already exists, not on a new model.

Connection

Plans, tests and evidence linked

We connect BCPs, DRPs, RTO/RPO, owners, controls and evidence to the corresponding graph nodes. Drills are recorded against the plan and the process they test. Gaps are identified on the graph, not in a text report.

Adoption

Ownership transferred to your team

We configure the resilience dashboard and alert flows that your continuity governance requires. At the end of the engagement, your team operates the solution independently. Assisted implementation, then your hands on the wheel.

Delivered in scoped engagements. Owned by your team after handoff.

Industry context

Industry landings where this solution applies

Reference landings explaining how the Operational Graph applies in each sector. Insurance and Oil & Gas preserve EAFlow's scope boundary: IT, process, change and evidence context only.

Business continuity Operational resilience BIA and RTO/RPO Drills and DRP Critical dependencies Operational risk

How this compares to existing tools

Operational Continuity & Resilience alongside BCM platforms

Enterprise BCM platforms (Fusion Framework, Castellan, Fusion Risk Management) provide full continuity management suites with approval workflows, notifications and regulatory compliance modules. Operational Continuity & Resilience focuses on the operating graph layer: connecting plans and test results to the real map of processes, applications and dependencies in the organization. It operates as the cross-system evidence layer that gives context to continuity governance, not as a replacement for the BCM suite.

— EAFlow's differentiating value in continuity is operational traceability: the BIA starts from the existing graph, not from a new spreadsheet.

Bring a real critical process to the table. We will walk through what the resilience model would surface on your Operational Graph, and what an assisted implementation could look like for your continuity governance.

Operational Continuity & Resilience is delivered as an assisted implementation on the EAFlow Operational Graph. Not a complete certified BCM and does not promise total regulatory resilience.